Cross-country fatigue factors: uncovering edges in basketball road games and football away fixtures through distance data
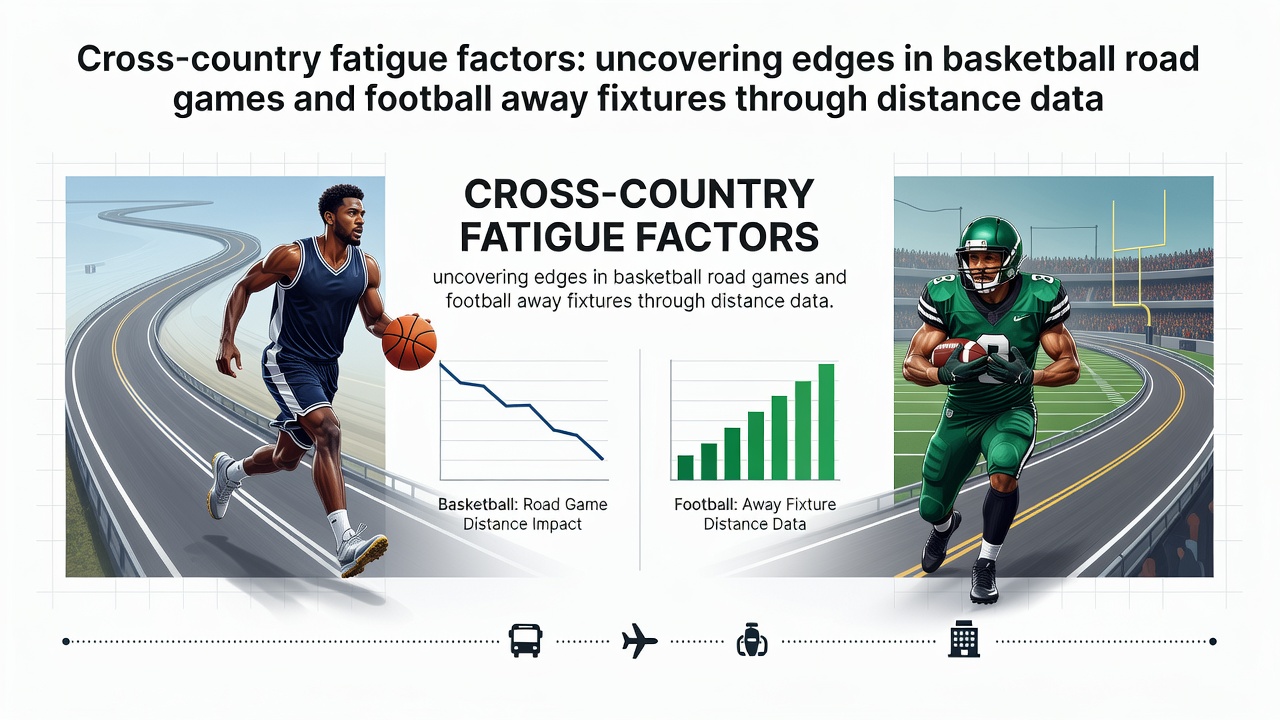
Travel distance shapes performance outcomes in professional basketball road games and football away fixtures more than many observers initially recognize, and data collected across multiple leagues continues to highlight measurable effects on player output. Researchers tracking flight miles, time zone crossings, and recovery windows have documented consistent patterns where teams traveling farther exhibit declines in shooting percentages, defensive efficiency, and overall point differentials, particularly when distances exceed 1,500 miles in a single week.
Mapping travel loads in basketball schedules
NBA teams log extensive mileage during regular seasons, and analysts reviewing 2025-2026 season logs note that squads crossing multiple time zones before back-to-back games show average drops of 4.2 points per game in net rating compared with home stands. College conferences present parallel trends, with NCAA Division I programs compiling distance statistics that correlate longer bus and plane trips with reduced rebounding rates and higher turnover counts. Observers examining conference tournament data from spring 2026 found that teams arriving from distances over 800 miles posted winning percentages 12 points lower than those with shorter intra-regional travel.
Football away fixtures and cumulative distance effects
Premier League and European domestic leagues compile fixture lists where away clubs often cover substantial ground between matches, and performance databases reveal that sides traveling beyond 300 miles for midweek games record fewer shots on target and lower possession retention in the opening 30 minutes. Studies of UEFA Champions League participants indicate that clubs crossing continents for group stage encounters experience elevated injury incidence rates in subsequent domestic fixtures, with hamstring strains rising notably after flights exceeding four hours. Australian A-League records from the 2025-2026 campaign further demonstrate that interstate travel above 1,000 kilometers links to measurable reductions in high-intensity running metrics tracked by GPS systems.
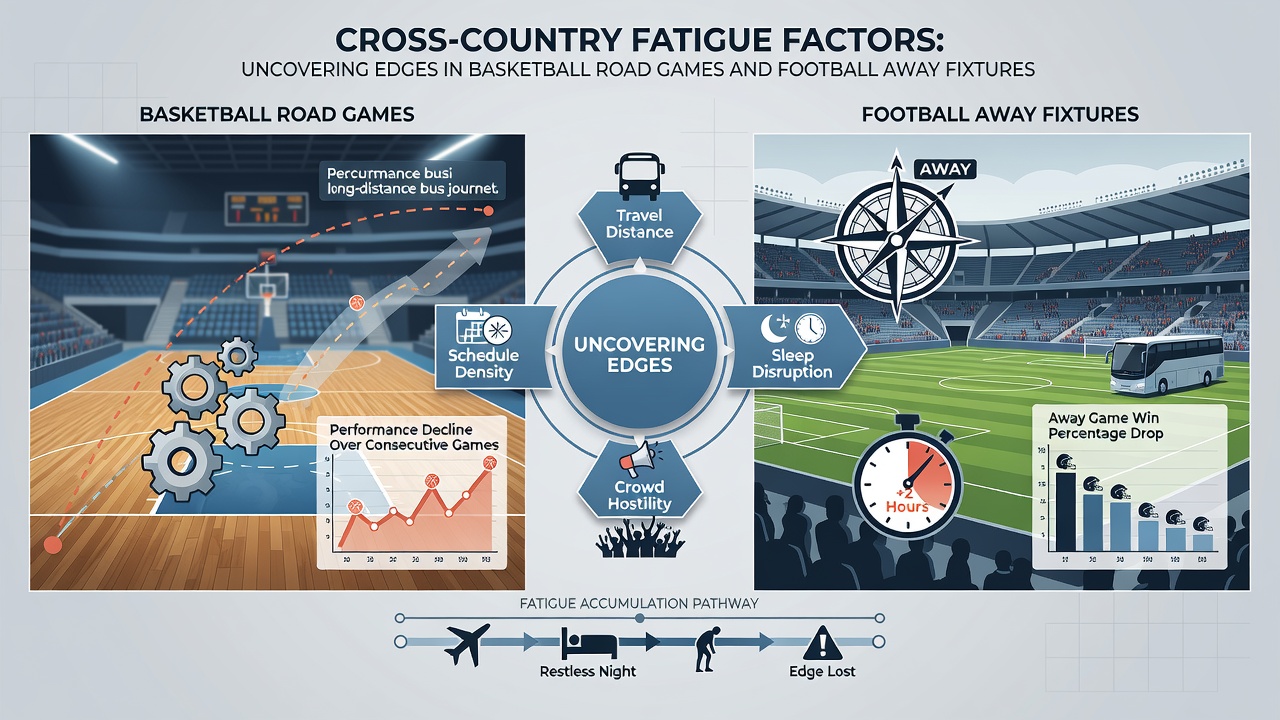
Key variables captured in distance datasets
Comprehensive models incorporate several measurable elements beyond raw mileage. Time zone shifts disrupt circadian rhythms, and physiological monitoring programs report delayed recovery in melatonin cycles for athletes crossing three or more zones. Flight duration combines with airport layovers to extend total time away from training facilities, while back-to-back scheduling amplifies fatigue accumulation. Data platforms maintained by league offices now integrate these variables into predictive frameworks used by performance staff, allowing comparisons across seasons.
One study released by sports science researchers at the University of Queensland examined 18 months of GPS and wellness questionnaire data from professional footballers and identified clear thresholds where total weekly travel kilometers predicted elevated rating of perceived exertion scores. Another dataset maintained by the NCAA sports science institute tracks similar metrics across basketball programs and shows parallel associations between cumulative distance and next-game field goal accuracy. Those who review these repositories note that combining distance with rest days produces stronger correlations than distance alone.
Seasonal patterns emerging in 2026
June 2026 offseason reviews of completed campaigns continue to surface additional layers. Basketball analysts processing full-season travel logs observe that early-season road trips produce milder performance dips than late-season equivalents, suggesting cumulative fatigue compounds across months. Football fixture congestion periods around international breaks coincide with spikes in away-game distance, and medical staff reports indicate higher soft-tissue injury occurrences during those windows. Teams that cluster long-haul fixtures early in schedules demonstrate different recovery trajectories compared with those facing them in the final stretch.
Integrating distance metrics into performance analysis
Performance analysts now cross-reference travel logs with box score outputs and biometric readings to isolate distance-related variance from other factors such as opponent strength or venue characteristics. Machine learning applications applied to these combined datasets generate probability adjustments for specific player roles, with perimeter shooters showing greater sensitivity to time zone changes than interior players in basketball samples. Football midfielders covering high distances in prior matches exhibit larger reductions in pass completion rates following extended travel. These layered approaches allow more precise identification of situational edges without relying on single-variable explanations.
Conclusion
Distance data provides a quantifiable lens for examining cross-country fatigue in basketball road games and football away fixtures, and ongoing collection efforts through 2026 continue to refine understanding of how mileage, time zones, and scheduling interact. Leagues and research institutions maintain expanding repositories that support detailed comparisons, while performance teams apply findings to training and recovery protocols. The patterns documented across multiple sports and regions underscore the value of incorporating travel metrics into broader analytical frameworks.