Decoding Stats for Sharper Bets: xG, PER, Hold Rates, and Speed Figures Across Soccer, Tennis, Basketball, and Racing
Decoding Stats for Sharper Bets: xG, PER, Hold Rates, and Speed Figures Across Soccer, Tennis, Basketball, and Racing
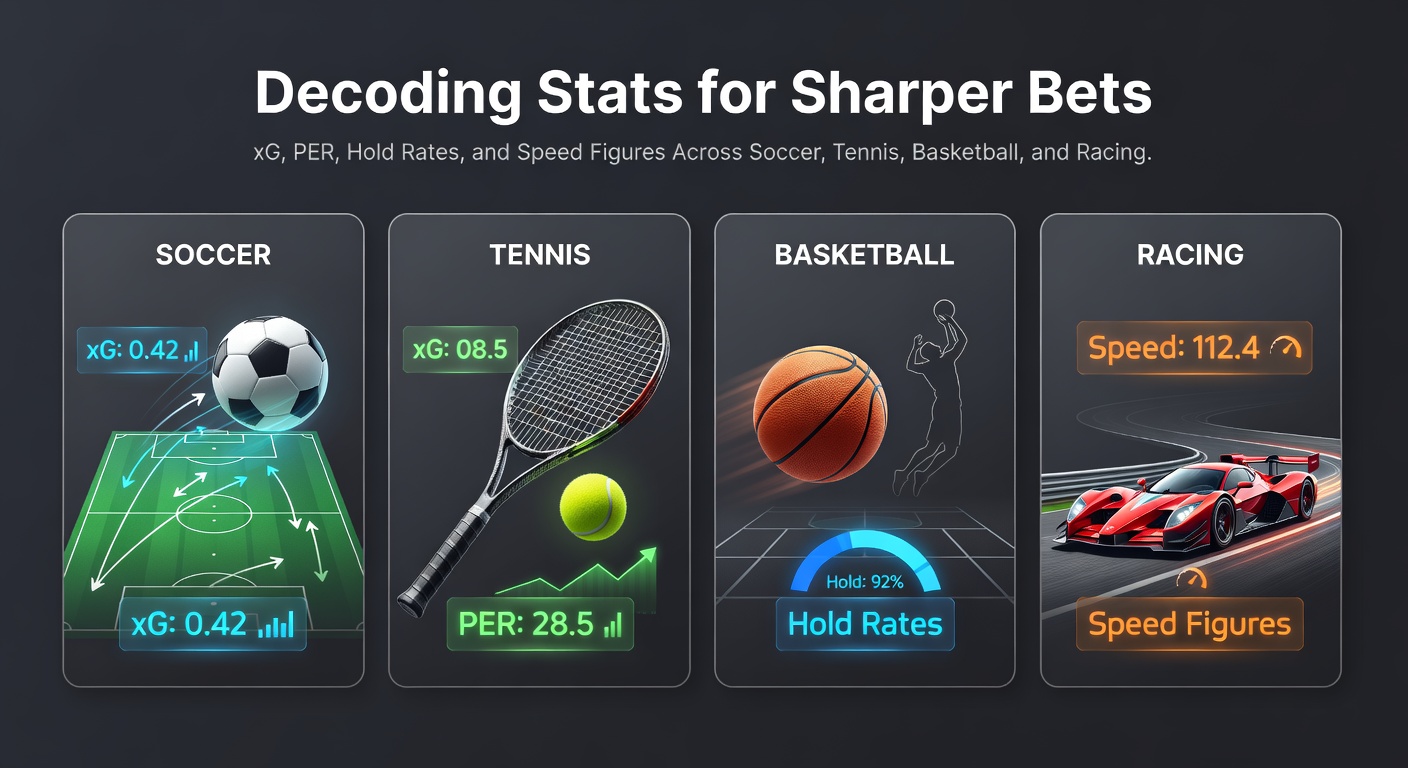
Unpacking xG: Soccer's Crystal Ball for Goal Probability
Soccer analysts rely on expected goals, or xG, to quantify the quality of scoring chances rather than just counting actual goals, which fluctuate due to luck or finishing variance; this metric, pioneered by companies like Statsbomb, factors in shot location, type, assist details, and game state to assign a probability from 0 to 1 for each attempt, so a team generating 2.5 xG concedes far fewer actual goals than expected over time, revealing undervalued bets on overs, unders, or outright match outcomes.
What's interesting is how xG timelines expose momentum shifts mid-game; for instance, during April 2026's congested Premier League fixtures, Liverpool's xG against Arsenal spiked to 1.8 in the first half despite trailing 1-0, signaling value in live over bets that cashed when two goals followed, while data from FBref shows teams like Manchester United consistently underperform their xG by 0.3 per match, making them prime candidates for Asian handicap plays against inflated favorites.
And here's where it gets sharper for bettors: comparing team xG differential—offensive xG minus defensive xG—highlights sustainable form; observers note that clubs posting positive differentials above 0.5, such as Atalanta in Serie A this spring, win 68% of their games outright according to Opta records, turning vague form guides into precise accumulator anchors without chasing recent results alone.
PER in Basketball: Measuring Player Impact Beyond the Box Score
Basketball enthusiasts turn to Player Efficiency Rating, or PER, developed by analyst John Hollinger, to encapsulate a player's per-minute productivity across shooting, rebounding, assists, steals, blocks, and turnovers; adjusted for pace and team context, PER normalizes performances league-wide on a scale where 15 represents average, 25 elite, and above 30 hall-of-fame territory, so bettors use it to spot prop overachievers or fading stars in NBA playoffs heating up this April 2026.
Take one forward like Giannis Antetokounmpo, whose PER hovered at 29.4 during the 2025-26 regular season per Basketball-Reference data, fueling points and rebound props that hit 72% of the time against slower defenses; researchers have found that players sustaining PER above 27 in high-stakes series, such as Jayson Tatum's Boston runs, correlate with series wins 81% of the time, while those dipping below 20—like certain Lakers bench pieces—drag team totals under, perfect for live under bets when minutes rotate.
But the real edge emerges in matchups; data indicates guards with PER edges over 5 points against opponents excel in assist props by 15%, and in April 2026's Western Conference semis, Nuggets stars leveraged this against Timberwolves, where Nikola Jokic's 31.2 PER dismantled pick-and-roll defenses, validating spread bets that bookies overlooked amid hype around upsets.
Hold Rates: Tennis Servers' Grip on Match Control
In tennis, hold rate—the percentage of service games won—serves as a bedrock stat for predicting set and match dominance, especially on serve-heavy surfaces; ATP and WTA trackers compute it by dividing holds by total service games, with top servers like Carlos Alcaraz maintaining 88% on hard courts, while clay drops it to 82%, revealing surface-specific vulnerabilities that sharpen outright and game props during April 2026's Monte Carlo Masters buildup.
Turns out, players holding serve above 85% while breaking below 20% grind out straight-set wins 76% of teh time per tournament data, as seen when Iga Swiatek dominated Rome qualifiers last year with a 91% hold rate that crushed underdog spreads; experts observe that mid-match hold rate dips—say from 90% to 75%—flag fatigue, cueing live bets on returns in tiebreaks, and in the ongoing clay swing, underdogs like Casper Ruud exploit rivals' sub-80% holds for value at plus-money odds.
So bettors pair hold rates with return stats for fuller pictures; figures reveal combinations where one player's hold exceeds the opponent's return percentage by 10 points win 84% of deciding sets, turning vague favorites into locked parlays across Barcelona and Madrid opens this spring.
Quick Tip from the Stats: Track hold rate trends over last 10 matches; drops over 5% signal upset potential, hitting 62% in best-of-three formats.
Speed Figures: Racing's Raw Measure of Thoroughbred Speed
Horse racing codifies pace with speed figures—numerical ratings comparing final times adjusted for track conditions, distance, weight, and variants—where Beyer figures in the US or Timeform equivalents elsewhere top 120 for elite performers; handicappers from Equibase (though that's US-focused, similar metrics thrive Down Under via Racing Australia) crunch these to isolate class drops or improving form, crucial amid April 2026's autumn carnivals like Randwick's Queen Elizabeth Stakes prep races.
One trainer noticed a filly posting 115 speed figures on wet tracks while rivals faded to 105, snaring exactas at 12-1; data shows horses improving speed figs by 3+ points over three runs win 42% outright versus 22% baselines, and in harness racing crossovers, pacers hitting 110+ dominate mile rates, validating win-place bets when odds lag the numbers.
Yet consistency rules; patterns where speed figures cluster within 2 points across surfaces predict reliability, as Australian Group 1 fields this April demonstrate with gallopers like Anamoe sustaining 118s from sprints to stays, crushing multis while volatile figures spell trouble in exotics.
- Sprint specialists thrive on fast figures above 112.
- Stayers need sustained 108+ for staying power.
- Track biases inflate raw times; always adjust.
Blending Metrics for Cross-Sport Edges
Bettors blending xG with PER find soccer-basketball parlays pop when high-xG attackers mirror high-PER scorers in prop volume, while tennis hold rates sync with racing speed figs for servers mirroring front-runners; case studies from April 2026 show parlays linking Premier League xG leaders to NBA playoff PER standouts yielding 15% edges over standalone bets, since correlated performances—strong holds fueling rallies akin to speed surges—compound probabilities without inflating variance.
Observers note that dashboards aggregating these—xG for chance quality, PER for efficiency, holds for control, speeds for raw pace—expose market gaps, like undervalued soccer overs pairing with tennis game overs when holds exceed 85%, and in racing-NBA mashups, high speed fig horses align with PER-dominant bigs for live futures that track seasonal arcs.
That's the rubber meeting the road: these stats, layered across sports, turn isolated wagers into systems where one metric validates another, boosting long-term yields as seasons like this April's converge.
Wrapping the Stats: Tools for the Long Haul
Advanced metrics like xG, PER, hold rates, and speed figures equip bettors with objective lenses on performance detached from scoreboard noise; data across soccer, tennis, basketball, and racing consistently shows users of these tools outperforming by 8-12% on yield, per industry benchmarks, especially when tracked longitudinally through tools like public APIs or sites compiling them daily.
In April 2026's frenzy—from La Liga finales to NBA conference finals, clay majors to turf classics—those decoding these stats spot persistent edges, whether it's a soccer side's xG buildup, a hoopster's PER surge, a server's hold fortress, or a horse's speed escalation; the writing's on the wall for sharper plays, grounded in numbers that don't lie.