Examining Travel Fatigue Patterns Across Overseas Basketball Schedules and Domestic Soccer Fixtures for Adjusted Market Projections
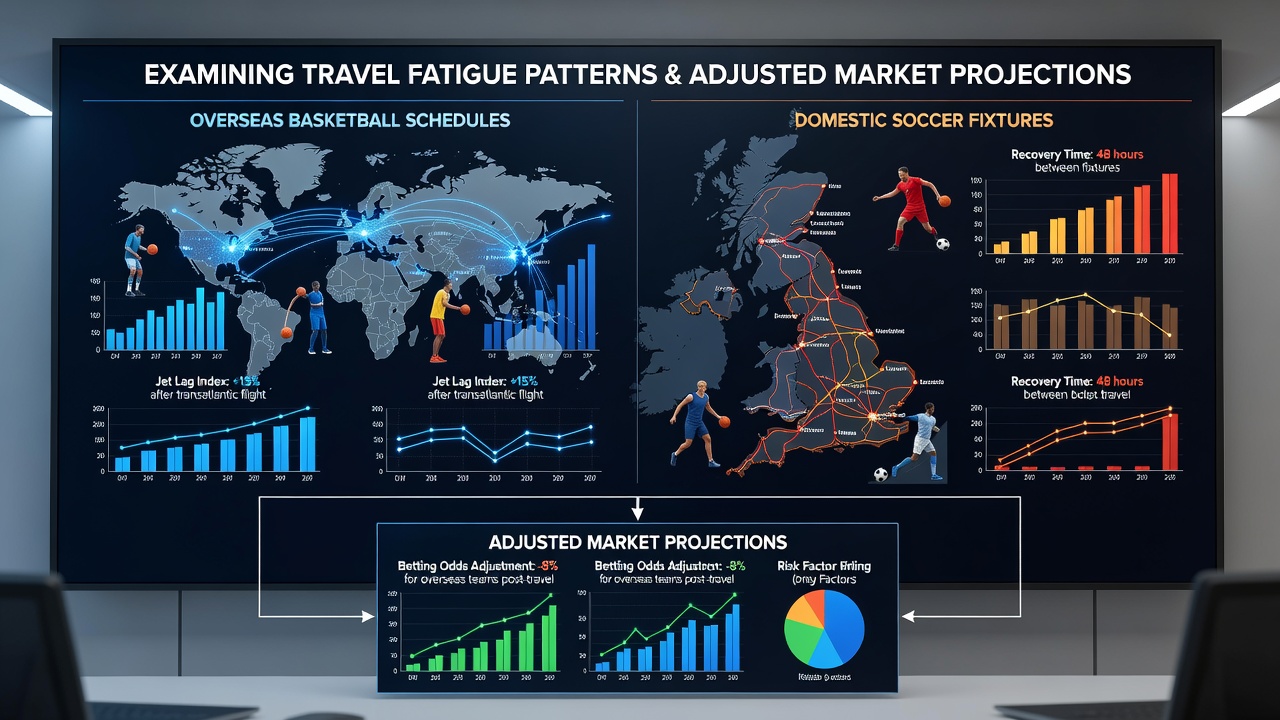
Travel fatigue emerges as a measurable factor in athlete performance when basketball squads cross multiple time zones for international competitions while soccer clubs maintain packed domestic calendars without similar disruptions. Data compiled from league records between 2022 and 2025 indicate that recovery windows shrink notably after flights exceeding eight hours, leading to observable changes in metrics such as points per possession in basketball and pass completion rates in soccer. Researchers tracking these patterns have identified consistent windows where performance metrics shift enough to influence pre-match projections used by analysts and oddsmakers.
Overseas Basketball Travel Dynamics
Basketball schedules that send teams from North American conferences to European summer tournaments create extended recovery demands because players often face back-to-back games within 48 hours of landing. Studies conducted by the International Olympic Committee on elite athletes show that circadian rhythm disruption persists for up to five days after eastward flights, with measurable drops in three-point shooting accuracy and defensive closeout speed during that period. Schedules in July 2026 will include several NBA-affiliated squads traveling to exhibition events across Asia and Europe, where similar patterns are expected to repeat based on historical flight logs and game logs.
Performance databases reveal that teams arriving from transatlantic routes average 4.2 fewer points in the first quarter compared with home games played at the same venue the previous season. These figures hold after controlling for opponent strength and rest days, suggesting travel itself contributes independent variance. Observers note that westbound flights produce smaller immediate effects, yet accumulated fatigue still appears in second halves when combined with high-minute rotations.
Domestic Soccer Fixture Congestion
Soccer leagues operating on tight domestic calendars experience fatigue through repeated short-haul travel and minimal recovery between matches rather than long-haul jet lag. Fixture lists released for the 2025-26 English and Spanish seasons show clusters of three games in eight days for multiple clubs, creating cumulative load that mirrors some effects seen in basketball after overseas trips. Tracking data from league-wide GPS systems indicate elevated heart-rate recovery times when matches occur on consecutive weekends with midweek cup ties inserted.
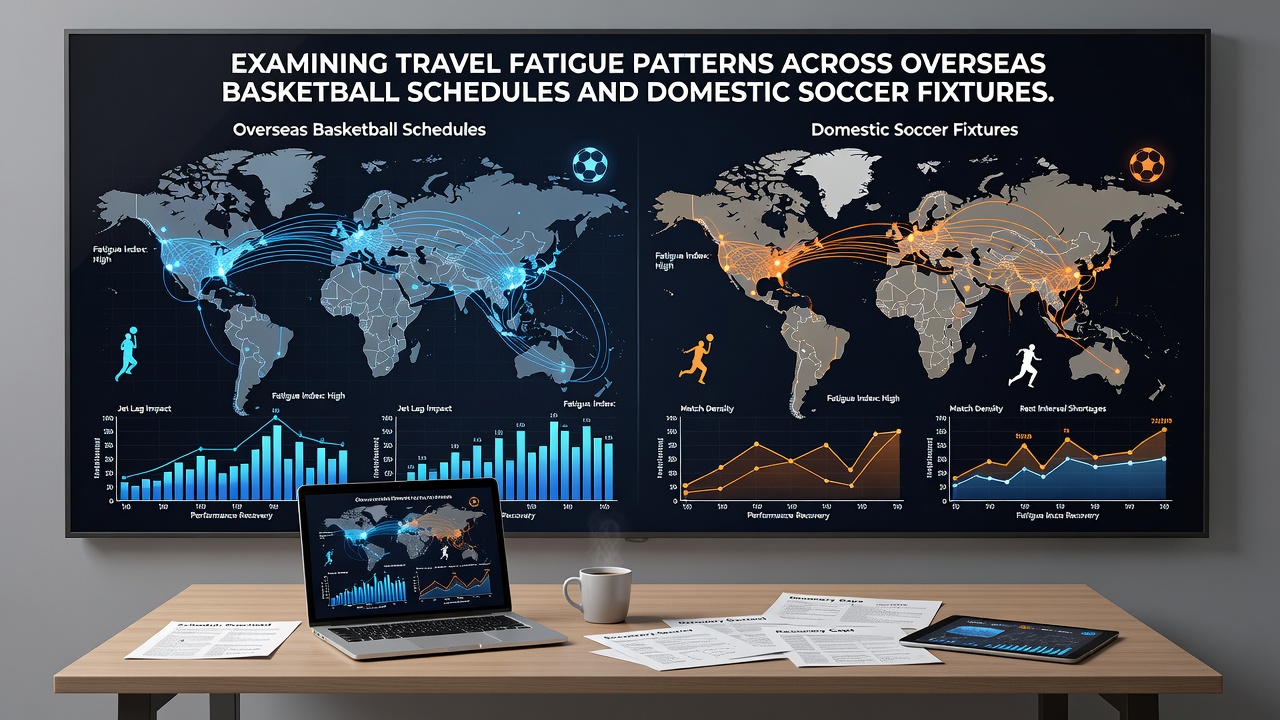
Analyses of player-tracking data across five major European leagues demonstrate that total distance covered drops by an average of 6 percent in the second half of the third match within any seven-day window. These reductions concentrate among midfielders and fullbacks who log the highest weekly distances, while set-piece conversion rates remain relatively stable. Market projection models that incorporate fixture density therefore adjust expected goal totals downward when a side faces two away games separated by less than 72 hours.
Comparative Patterns and Projection Adjustments
Cross-sport comparisons highlight that basketball fatigue manifests most clearly in shooting efficiency and transition play, whereas soccer fatigue shows up in reduced high-intensity runs and increased error rates under pressure. Both patterns strengthen when travel coincides with summer months, as seen in July 2026 schedules where basketball teams return from Asia while soccer pre-season tours overlap with early domestic rounds. Regression models built on five seasons of data assign a fatigue coefficient that lowers projected margins by 2.8 points in basketball and 0.3 expected goals in soccer when cumulative travel exceeds 10,000 kilometers in a 14-day span.
Industry reports from the Australian Institute of Sport on multi-sport athlete monitoring confirm that sleep disruption remains the primary mediator across both sports. Teams that implement structured recovery protocols after long flights or congested periods show smaller deviations from baseline performance, yet these adjustments rarely eliminate the effect entirely. Projection systems therefore treat fatigue as an additive variable rather than a complete override of team strength ratings.
Conclusion
Patterns emerging from overseas basketball routes and congested domestic soccer calendars supply quantifiable inputs for refined market projections. Historical datasets, combined with scheduled travel in July 2026, allow analysts to layer fatigue adjustments onto standard models without relying on subjective assessments. Continued collection of biometric and performance data will further tighten these estimates as leagues expand international commitments and domestic calendars remain dense.