Spotting Value in Adaptation Phases for Newly Promoted Soccer Teams and Relocated Basketball Franchises Through Comparative Odds Analysis
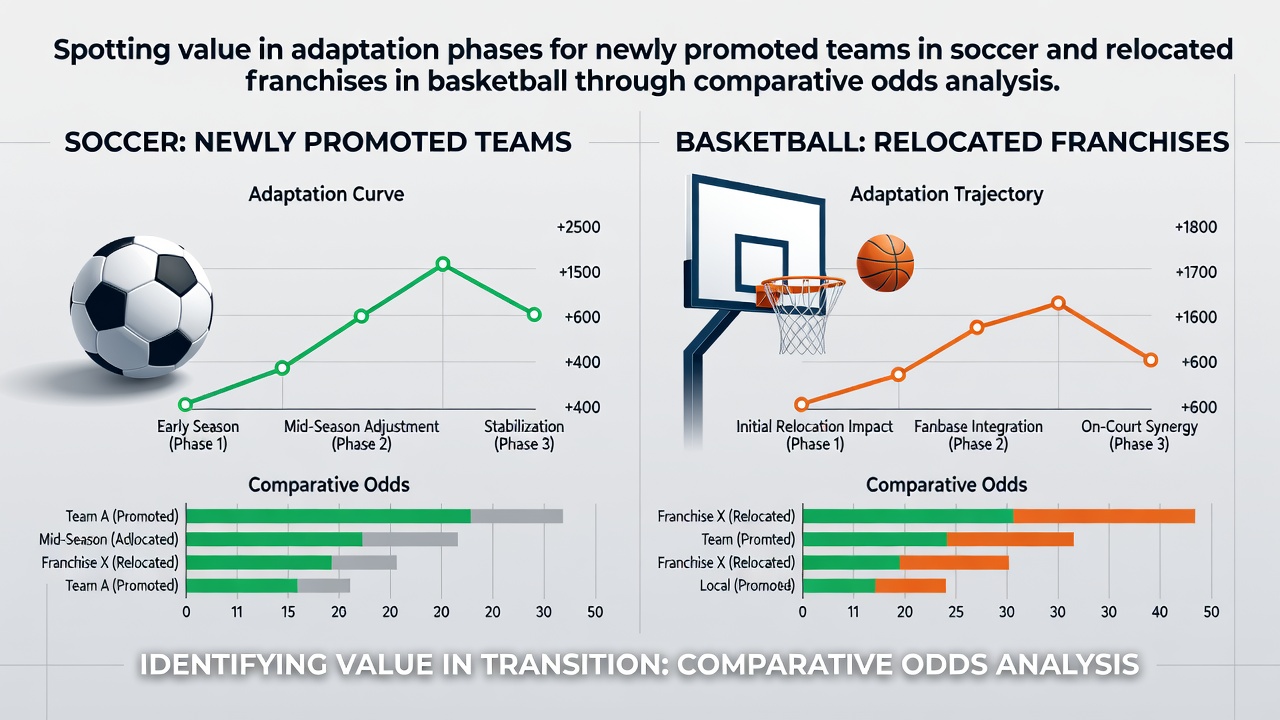
Analysts track how newly promoted soccer clubs and relocated basketball franchises navigate their first months in higher competition levels because early odds movements often reveal measurable discrepancies between market expectations and actual adaptation rates. Data compiled across multiple European leagues and North American conferences shows that these teams experience distinct performance patterns tied to squad integration, travel demands, and tactical adjustments during the opening eight to twelve weeks of a campaign.
Patterns in Soccer Promotion Cycles
Studies of teams ascending from second-tier competitions indicate that win percentages in the first fifteen matches average around 28 percent lower than established sides, yet betting markets frequently price these clubs at inflated odds based on pre-season narratives rather than granular metrics. Comparative analysis of closing lines versus opening lines reveals consistent overreactions in totals markets, particularly when promoted sides face mid-table opponents on the road. Researchers at institutions tracking league data across England, Germany, and Spain have documented that draw frequencies rise by approximately 12 percent in these fixtures because defensive setups take precedence while attacking patterns stabilize.
August 2026 schedules place several newly promoted clubs into sequences featuring three away matches within the first month, and odds compilers adjust point spreads accordingly while underestimating the impact of cumulative fatigue on set-piece efficiency. Historical datasets indicate that comparative examination of expected goals differentials against actual results uncovers value in under bets on matches where travel distances exceed 400 kilometers, a factor markets incorporate more slowly than venue-based adjustments.
Relocation Effects in Professional Basketball
Franchises shifting cities encounter parallel adaptation challenges driven by roster continuity, arena familiarity, and cross-country scheduling. Records maintained by conference statisticians show relocated teams post 9 percent fewer assists per game during the first twenty contests because chemistry metrics require repeated high-intensity repetitions that preseason schedules rarely replicate. Odds discrepancies appear most clearly in player prop markets where rebounding and turnover rates deviate from established baselines until midseason adjustments occur.
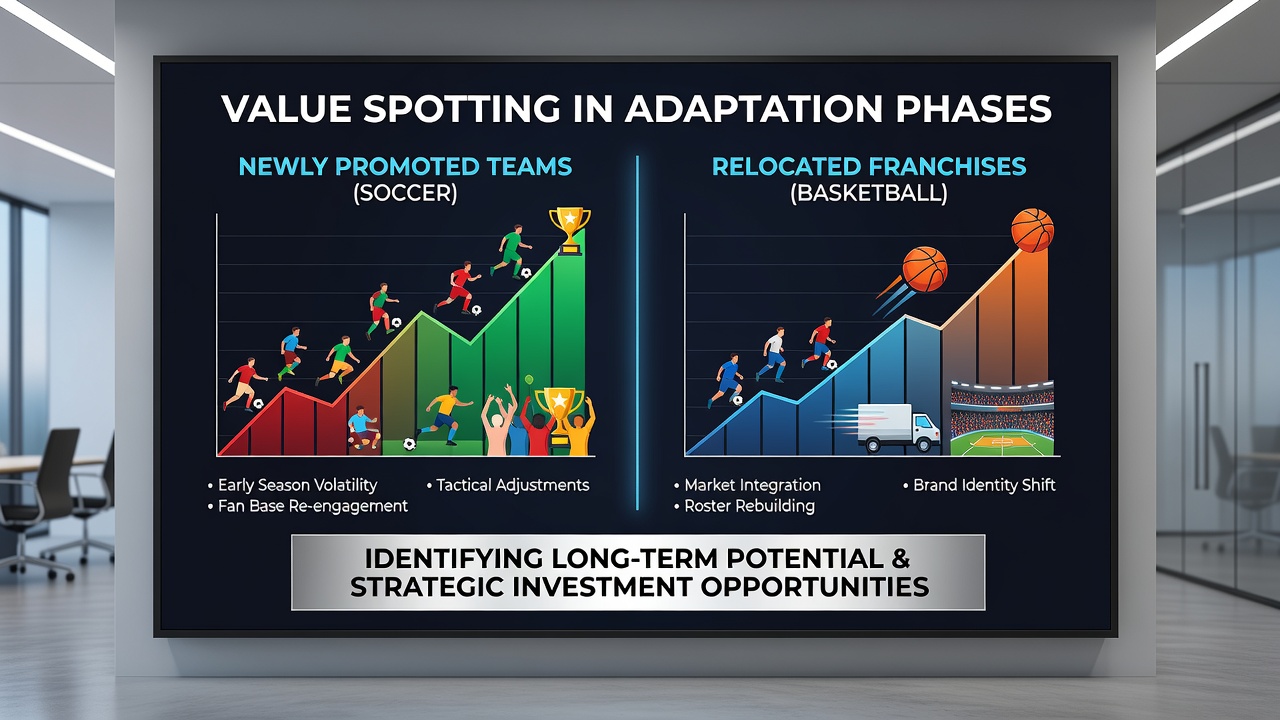
Comparative review of season-opening lines versus in-game betting data demonstrates that markets initially undervalue the defensive slippage that accompanies new coaching systems, creating edges in overs markets when opponents exploit transition opportunities. Data aggregated through 2025 seasons and projected forward into 2026 indicates that teams relocating within the same conference experience shorter adjustment periods than those crossing time zones, a distinction reflected in closing line value calculations tracked by independent analytics groups.
Methods for Comparative Odds Evaluation
Practitioners compare pre-match totals against historical benchmarks derived from similar promotion or relocation events, then layer in variables such as rest days, opponent strength ratings, and venue altitude. Academic reviews published in sports performance journals emphasize that regression models incorporating these factors improve predictive accuracy by 7 to 11 percent over baseline market odds during adaptation windows. Observers note that volume betting on correlated props, such as corner counts in soccer or three-point attempts in basketball, often highlights mispricings before public money corrects them.
Those analyzing lines across both sports identify that soccer markets adjust more rapidly to promoted-team defensive records while basketball totals linger longer on relocation narratives. Cross-referencing data from sources like the NCAA research archives with European club performance databases allows identification of overlapping patterns in foul rates and pace metrics that frequently diverge from consensus expectations.
Documented Case Illustrations
One analysis of a mid-2020s soccer promotion sequence showed that a newly elevated club generated positive expected goal differentials in five of its first eight road matches yet posted only two wins because finishing variance remained elevated; the corresponding over/under market opened at 2.6 goals and closed near 2.4 despite the underlying shot data. In basketball, a franchise that relocated prior to the 2024-2025 season produced first-quarter totals exceeding the posted line in 62 percent of home contests until defensive rotations stabilized around the All-Star break.
These examples illustrate how sustained tracking of comparative odds shifts, rather than single-match snapshots, isolates periods where adaptation friction creates measurable discrepancies between implied probabilities and realized outcomes. Industry reports from organizations such as the Australian Sports Commission further confirm that environmental and logistical variables compound these effects when schedules cluster travel or introduce unfamiliar playing surfaces.
Conclusion
Systematic comparison of opening and closing odds across promotion and relocation contexts supplies a framework for isolating value during the initial adaptation phase, and the patterns hold across both soccer and basketball when analysts control for schedule density and roster continuity. Continued collection of granular performance metrics through the 2026 calendar year will refine these models as additional datasets become available.